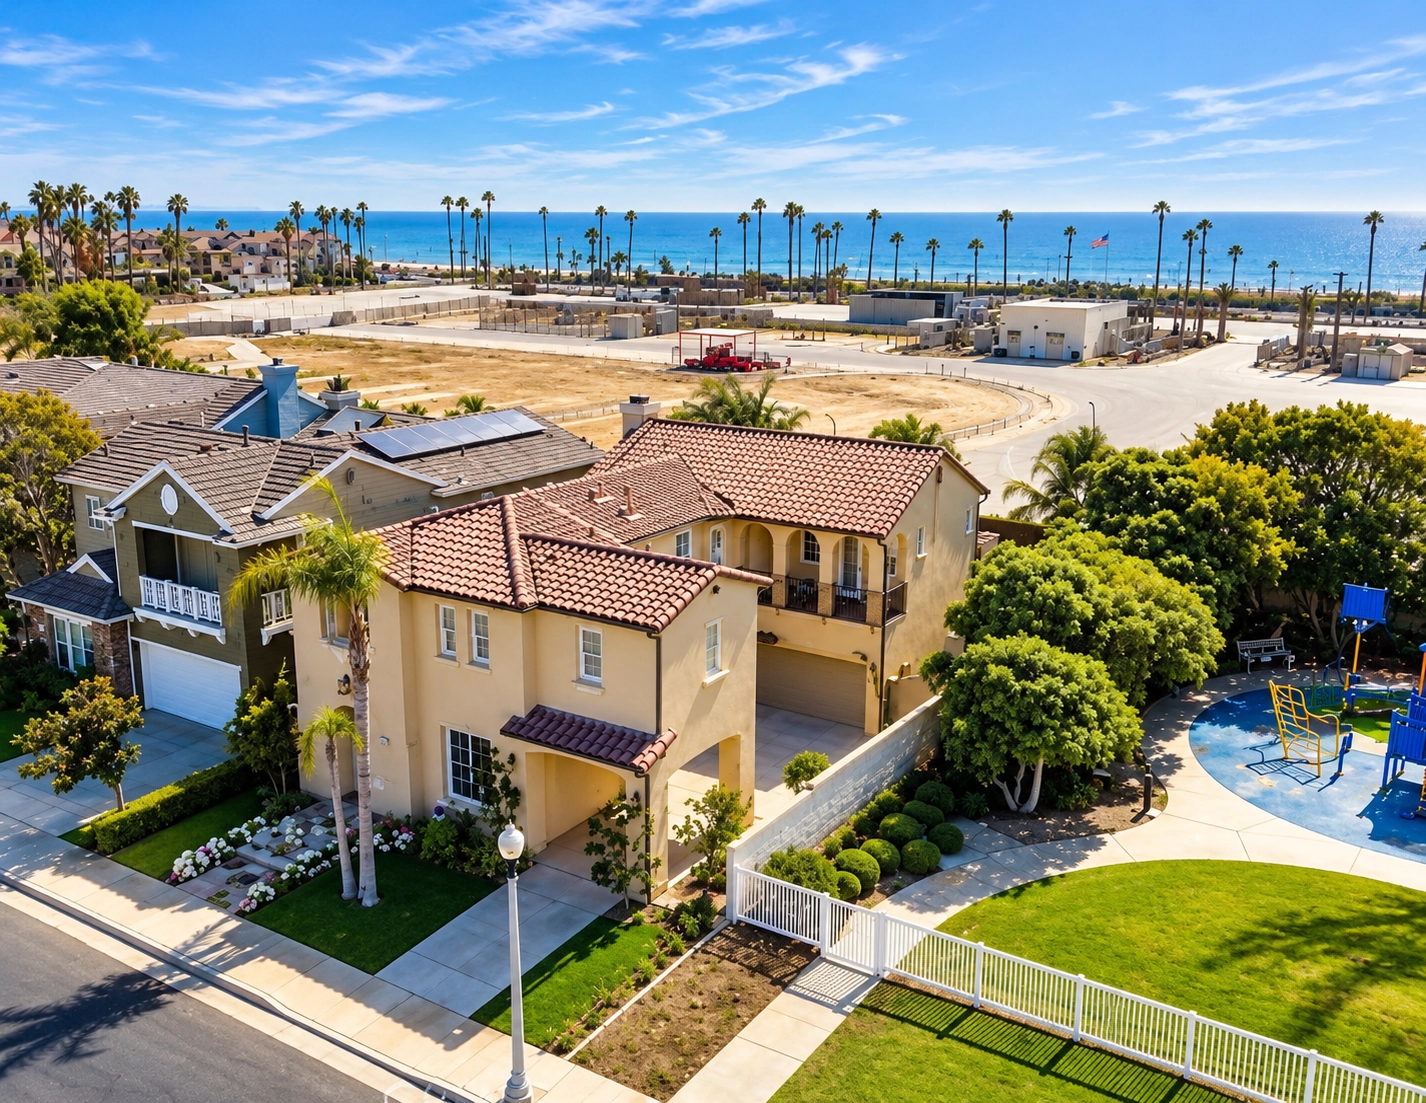
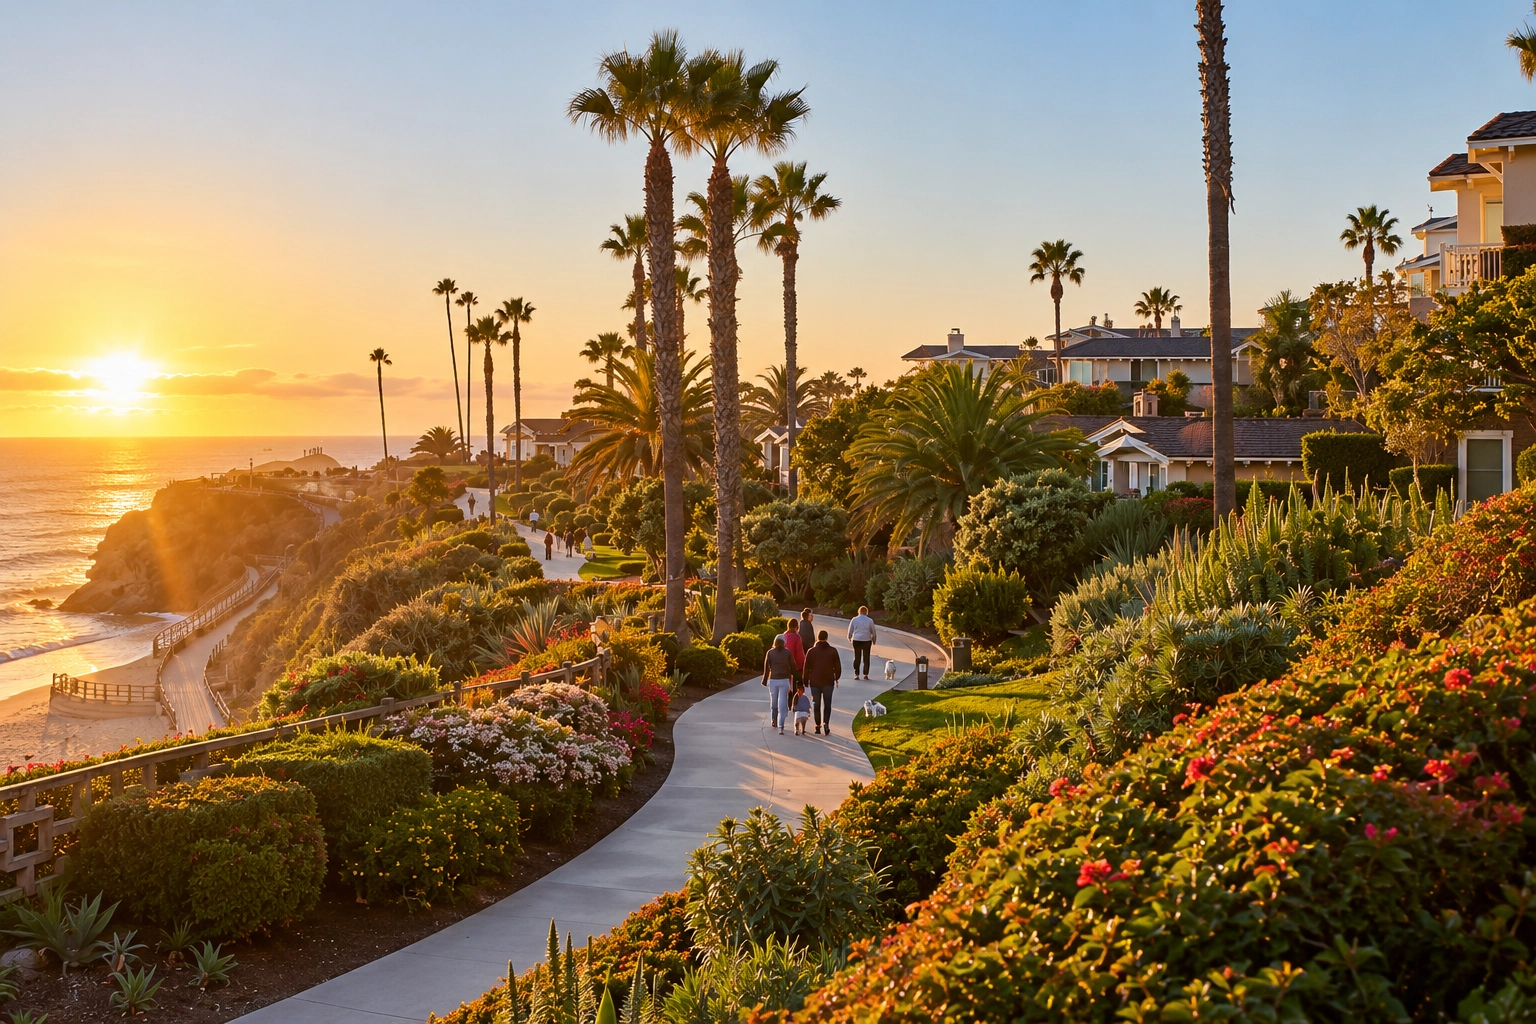
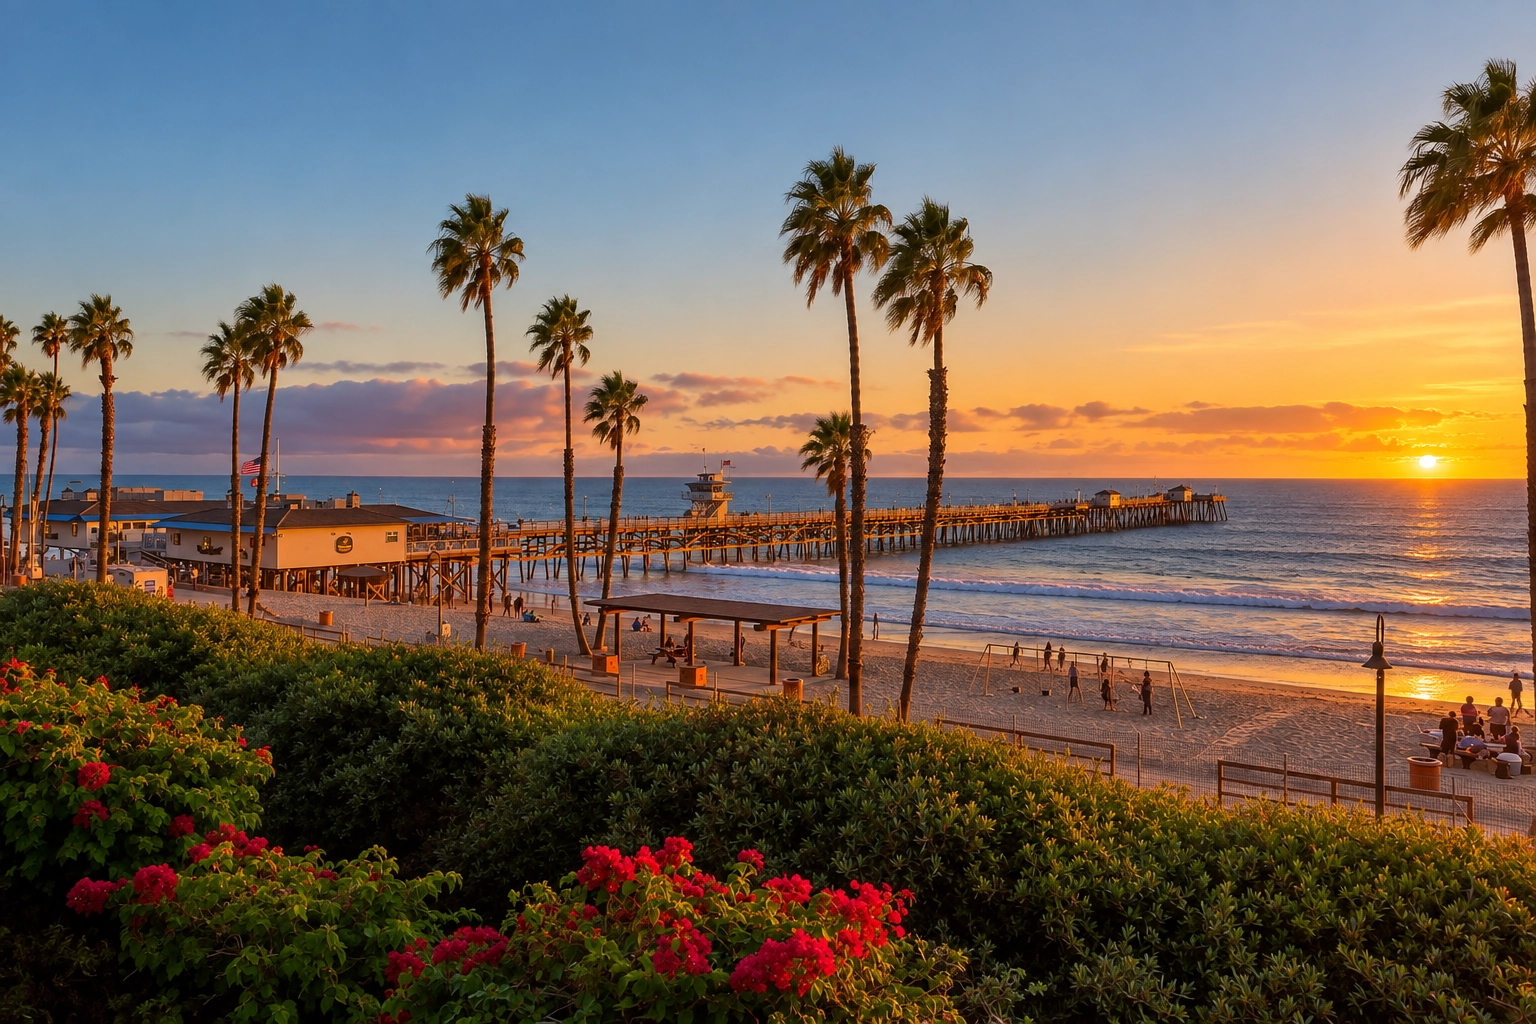
Surf City demand stayed durable through 2026 — but durable demand is not the same as a pricing strategy.
Every week an owner asks me some version of the same question: what will my Huntington Beach home rent for? It sounds simple. It isn’t. A Zillow “Rent Estimate” treats a Huntington Harbour waterfront home and a tract house two miles inland as if they belong to the same market. They don’t. In Surf City, the number that rents your home fast — and the number that leaves money on the table — often sit only a few hundred dollars apart.
So let’s do this properly. Below are the current rent ranges across Huntington Beach for 2026, broken out by home size and by neighborhood, with the sources named. Then I’ll walk through how I’d actually price your home — because the market rate is a starting point, not an answer.
Huntington Beach rent, at a glance (mid-2026)
Across the aggregators, Huntington Beach sits firmly in Orange County’s upper tier. As of mid-2026, Zumper puts the citywide one-bedroom median around $2,400 and the two-bedroom around $3,080, while Rent.com reports an overall apartment average near $2,824 — up roughly 1.4% year over year. RentCafe’s neighborhood data lands in a similar band, with studios near $2,250, one-bedrooms near $2,530, two-bedrooms near $3,090, and three-bedroom units pushing past $4,200.
For detached single-family homes — the bulk of what I manage in HB — the numbers run higher than the apartment averages. A smaller two- to three-bedroom house commonly lands in the $3,800–$4,800 range, and larger four-bedroom homes, especially near the water or in Seacliff, routinely clear $5,500 and up. Treat every figure here as a directional range, not a quote: these are third-party market medians, and your home’s condition, parking, and proximity to the sand move it inside that band.
One number I can speak to directly: our homes rent in about 18 days on average, versus roughly 32 for the OC market. In a city this seasonal, two weeks of saved vacancy is often worth more than the last $75 of monthly rent.
Proximity to the water is the single biggest swing factor in an HB rent — sometimes worth several hundred dollars a month.
What your home commands by neighborhood
Huntington Beach is really a handful of distinct micro-markets. The same floor plan can command very different rent depending on which of these it sits in.
Huntington Harbour
The waterfront pocket in the northwest — canals, docks, boat slips. This is the top of the HB rental market. Homes with a dock or direct water access carry a meaningful premium over anything comparable inland, and tenants here expect it. Pricing a Harbour home off a generic citywide estimate is the single most common way owners underprice in this city.
Downtown / Main Street & the numbered streets
Walkable to the pier, the shops, and the sand. Demand here skews toward tenants who will pay for lifestyle and location over square footage. Smaller homes and duplexes rent quickly, and short walk times to the beach support rents at the upper end of their size class.
Southeast HB & Seacliff
Quieter, more family-oriented, strong schools, larger lots. Seacliff in particular draws longer-term family tenants who value stability — which is exactly the profile you want. Rents here are driven by home size and finish quality more than by beach proximity.
Central and inland HB (Bolsa Chica-Los Amigos, Goldenwest area)
The most attainable end of the HB market and, frankly, the best value for tenants. Rents track closer to the citywide medians above. These homes rent well when priced honestly against comparable inland stock rather than against the coastal listings a tenant just scrolled past.
Two homes on the same street can rent hundreds apart based on updates, parking, and yard — the comps have to match the home.
Why the “estimate” is usually wrong for your home
Automated estimates are built for averages, and your home is not average. Here’s what actually moves the number, in roughly the order I weigh it:
Distance to the water — the biggest single lever in HB. Walkability to the sand or a Harbour dock can add several hundred dollars a month.
Condition and updates — an updated kitchen, in-unit laundry, and fresh flooring routinely justify a higher band; tired finishes pull you to the bottom of it.
Parking — a garage plus driveway is a real premium in beach-adjacent neighborhoods where street parking is a nightly battle.
Outdoor space — a usable yard or patio matters more here than almost anywhere inland.
Timing — this one is underrated, so it gets its own section.
Seasonality: when you list changes what you get
Huntington Beach rents move with the calendar. Market data shows roughly a 3–4% swing between the peak summer leasing months and the slower winter stretch — meaning the same home can command noticeably more in June than in December. If your lease is ending in the off-season, small choices matter: a slightly shorter or longer term to reset the renewal into spring, sharper pricing, or a faster turnaround to avoid carrying a winter vacancy. I’ve seen too many owners insist on a summer number in November and then eat six weeks of empty house proving the market right.
How I’d price your home
When I run a rental analysis, I’m not pulling a citywide average — I’m building your number from the ground up: three to five genuinely comparable HB homes leased in the last 60–90 days, adjusted for water proximity, condition, parking, and the season you’re listing into. Then I pressure-test it against what’s currently active, because your real competition is the homes a tenant can tour this weekend, not what leased last spring.
The goal isn’t the highest theoretical rent — it’s the highest rent that still leases quickly. In a seasonal beach market, an overpriced listing doesn’t just sit; it trains the market to see your home as stale, and the eventual “reduced” price often lands below where an honest number would have started. Getting it right the first time is the whole game, and it’s backed by our transparent flat pricing — no setup, marketing, or markup costs layered on top.
As of mid-2026, third-party sources put the citywide apartment average near $2,800, with one-bedrooms around $2,400–$2,530 and two-bedrooms around $3,080–$3,090 (Zumper, Rent.com, RentCafe). Detached single-family homes generally run higher — commonly $3,800 and up depending on size, condition, and how close they sit to the water.
Huntington Harbour and the downtown/numbered-streets area near the pier sit at the top, driven by water access and walkability. Seacliff and Southeast HB command strong family rents on size and finish, while central and inland HB tracks closer to the citywide medians.
Late spring and summer are the peak leasing window, with rents running a few percent above the winter trough. If you’re forced to list in the off-season, pricing sharply and minimizing vacancy usually beats holding out for a summer number the winter market won’t pay.
They’re a starting point, not an answer. Automated tools average across a market that isn’t uniform — a waterfront Harbour home and an inland tract house get blurred together. For a detached home, a comp-based analysis adjusted for water proximity and condition is far more reliable.
This post is general guidance, not legal advice. Rent figures are third-party market estimates as of mid-2026 and will change; consult a California real estate professional for property-specific pricing. Consult a California real estate attorney for legal questions.
About the author
Adam Tomalas
Adam is the founder and designated broker of Bear Property Management Co., a boutique residential property management firm serving 15 cities across Orange County. He personally reviews every rental analysis and signs every Bear Promise guarantee.
CA DRE #02222825 · Member, California Association of REALTORS® · Newport Beach, CA
Saying “no pets” feels safe, but it may be quietly costing you tenants and rent. Here’s the honest math on allowing pets in an Orange County rental — the upside, the real risks, and how to write a pet policy that protects your home.
Owners obsess over price and condition — as they should — but the calendar quietly does just as much to determine how fast a home leases and for how much. In a family-heavy market like Orange County, timing your listing to the school year can be the difference between a
San Clemente rents span a wide range — a Talega family home and a Southwest beach cottage play by different rules. Here’s a neighborhood-by-neighborhood look at what drives rent in 2026 and how to price your home without leaving money on the table.
See the numbers for your property
Get a free rental analysis —personally reviewed by Adam.
Tell us about your property and within 24 hours you’ll receive a written analysis prepared specifically for your address. No obligation, no pressure.